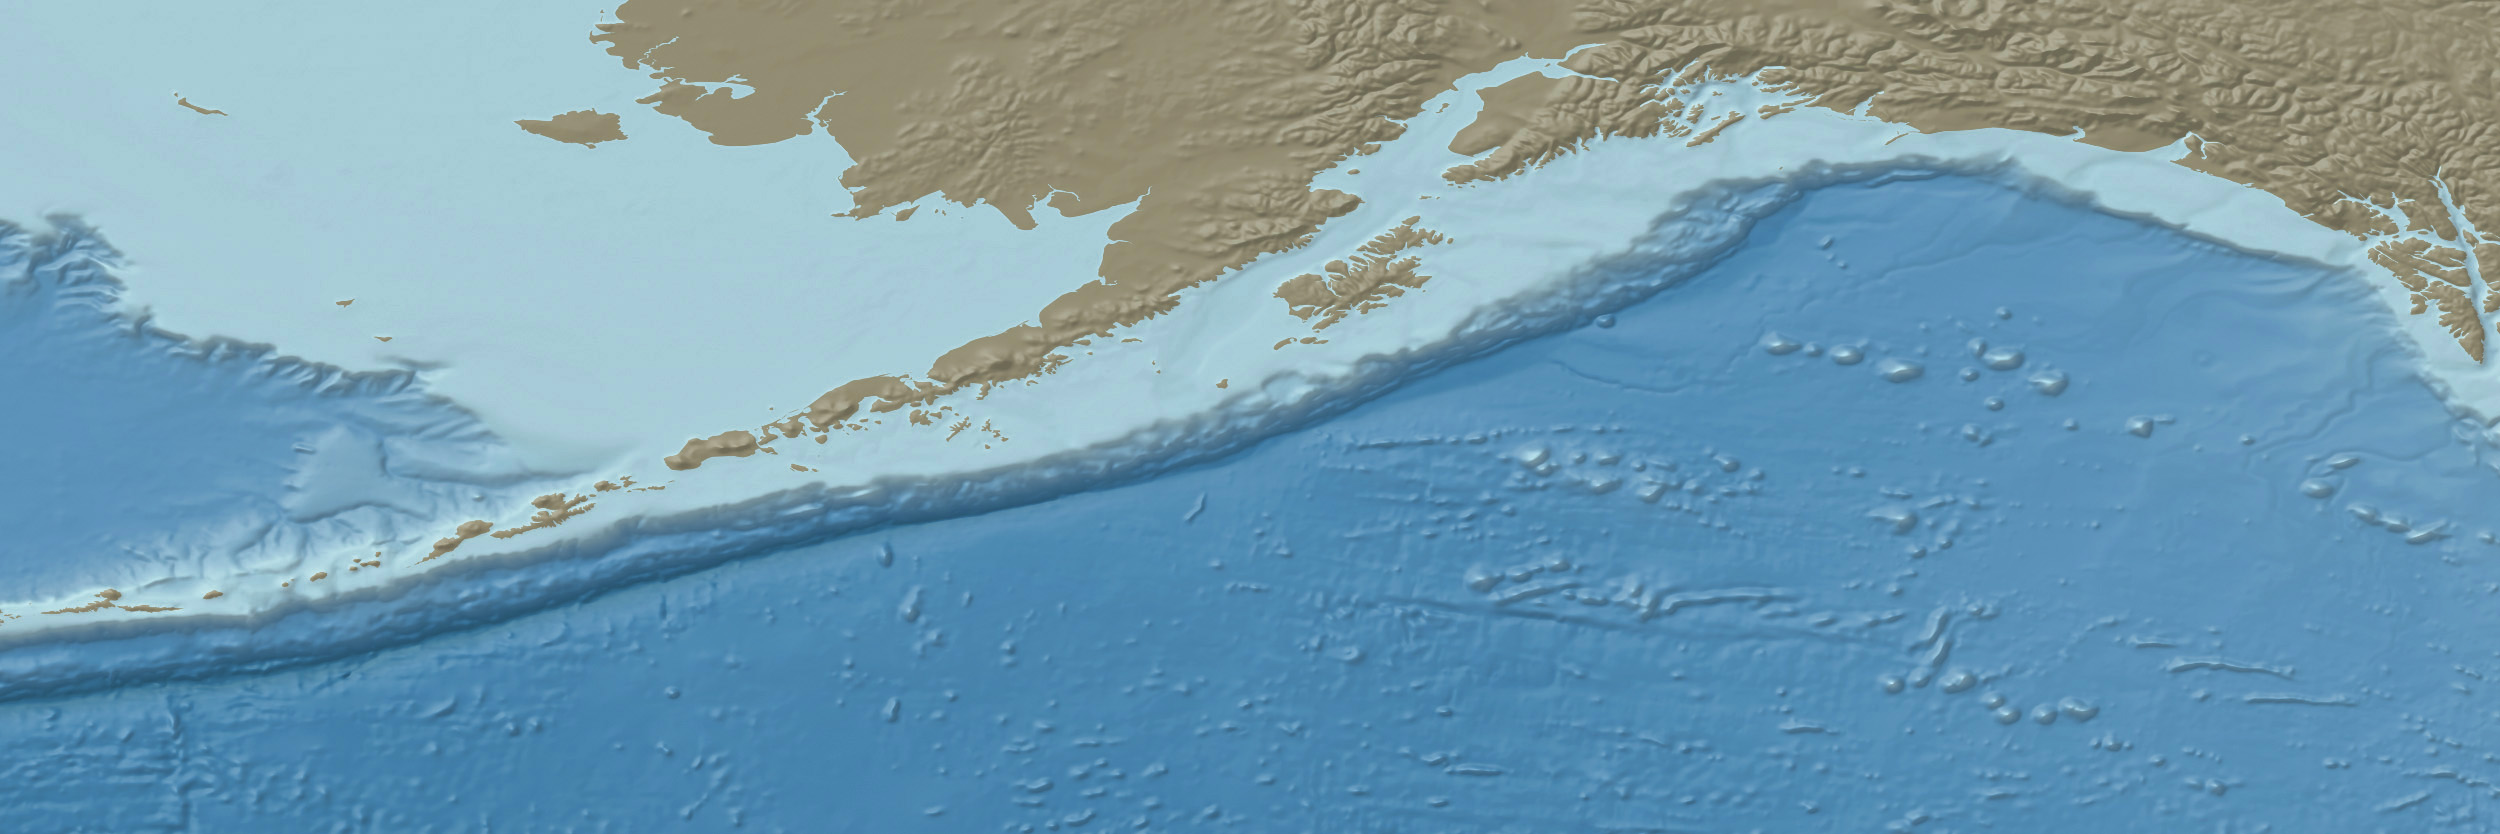
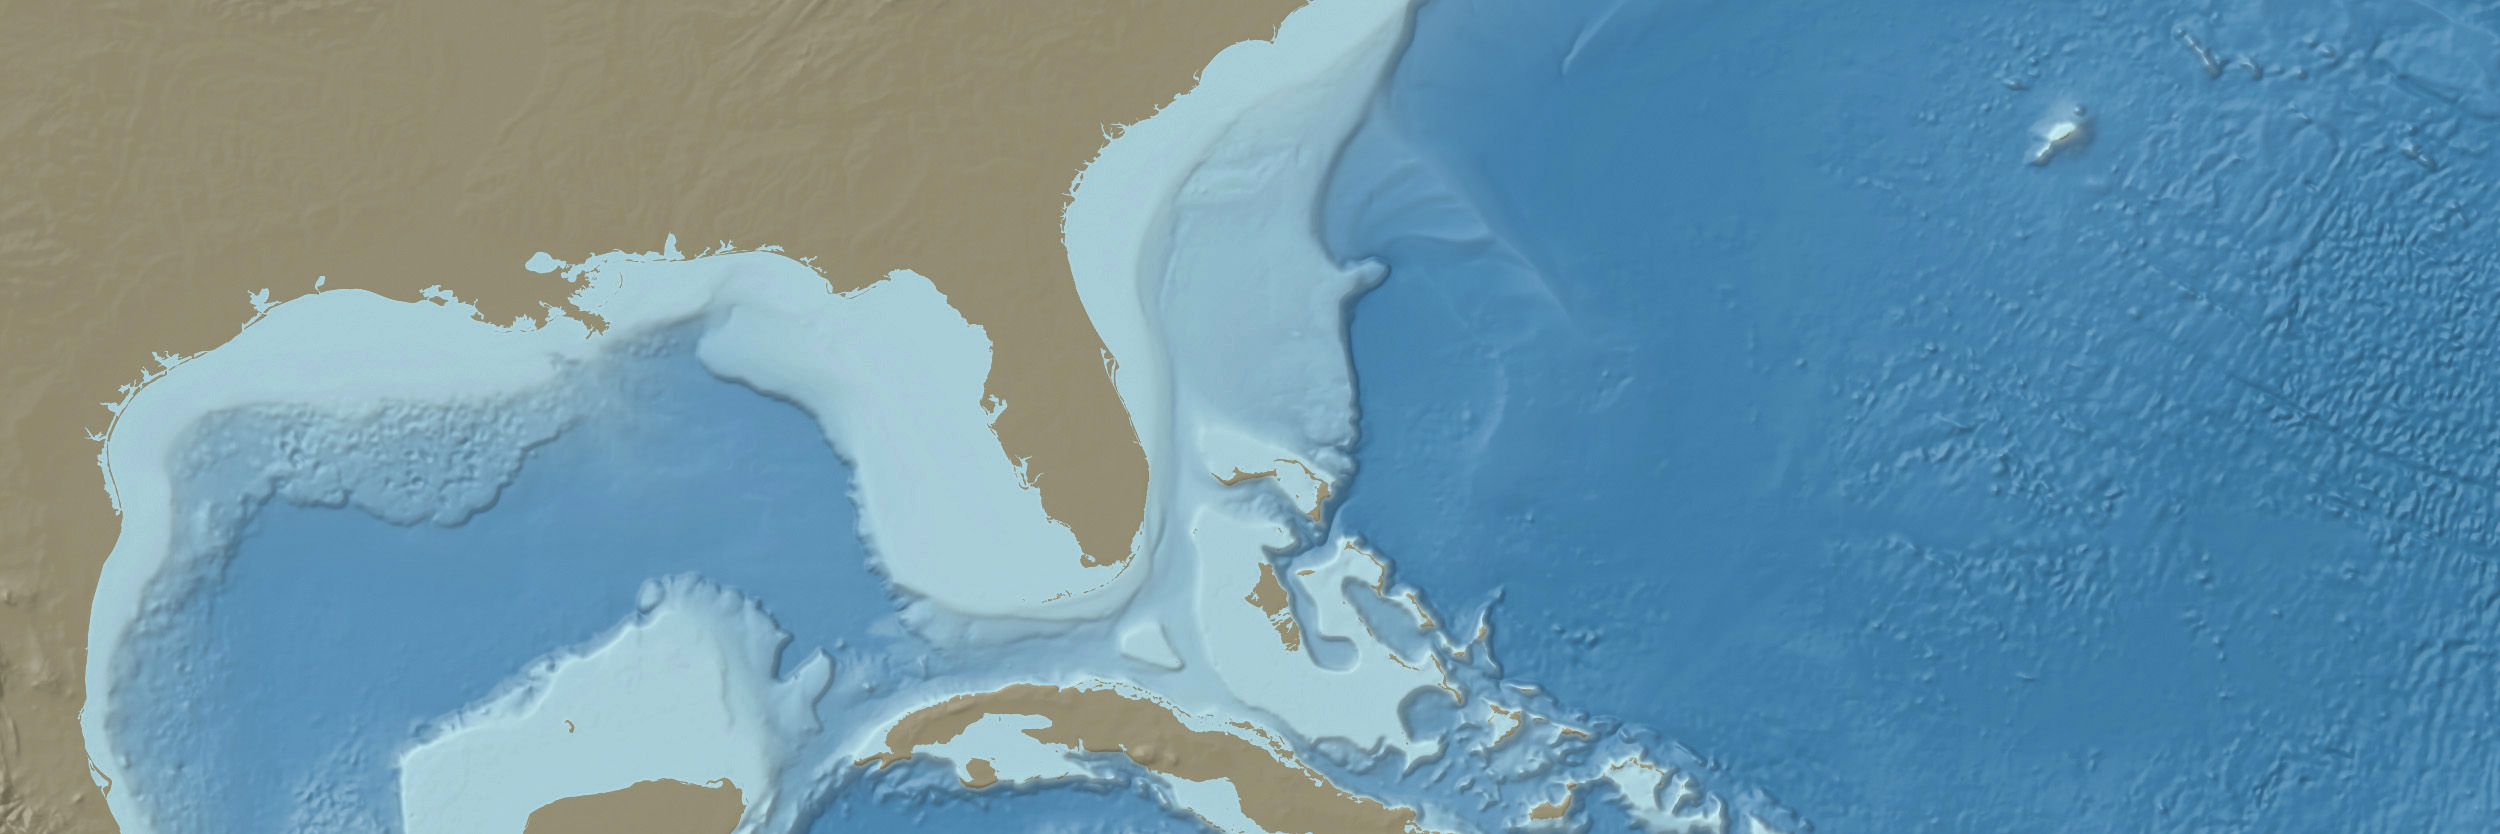
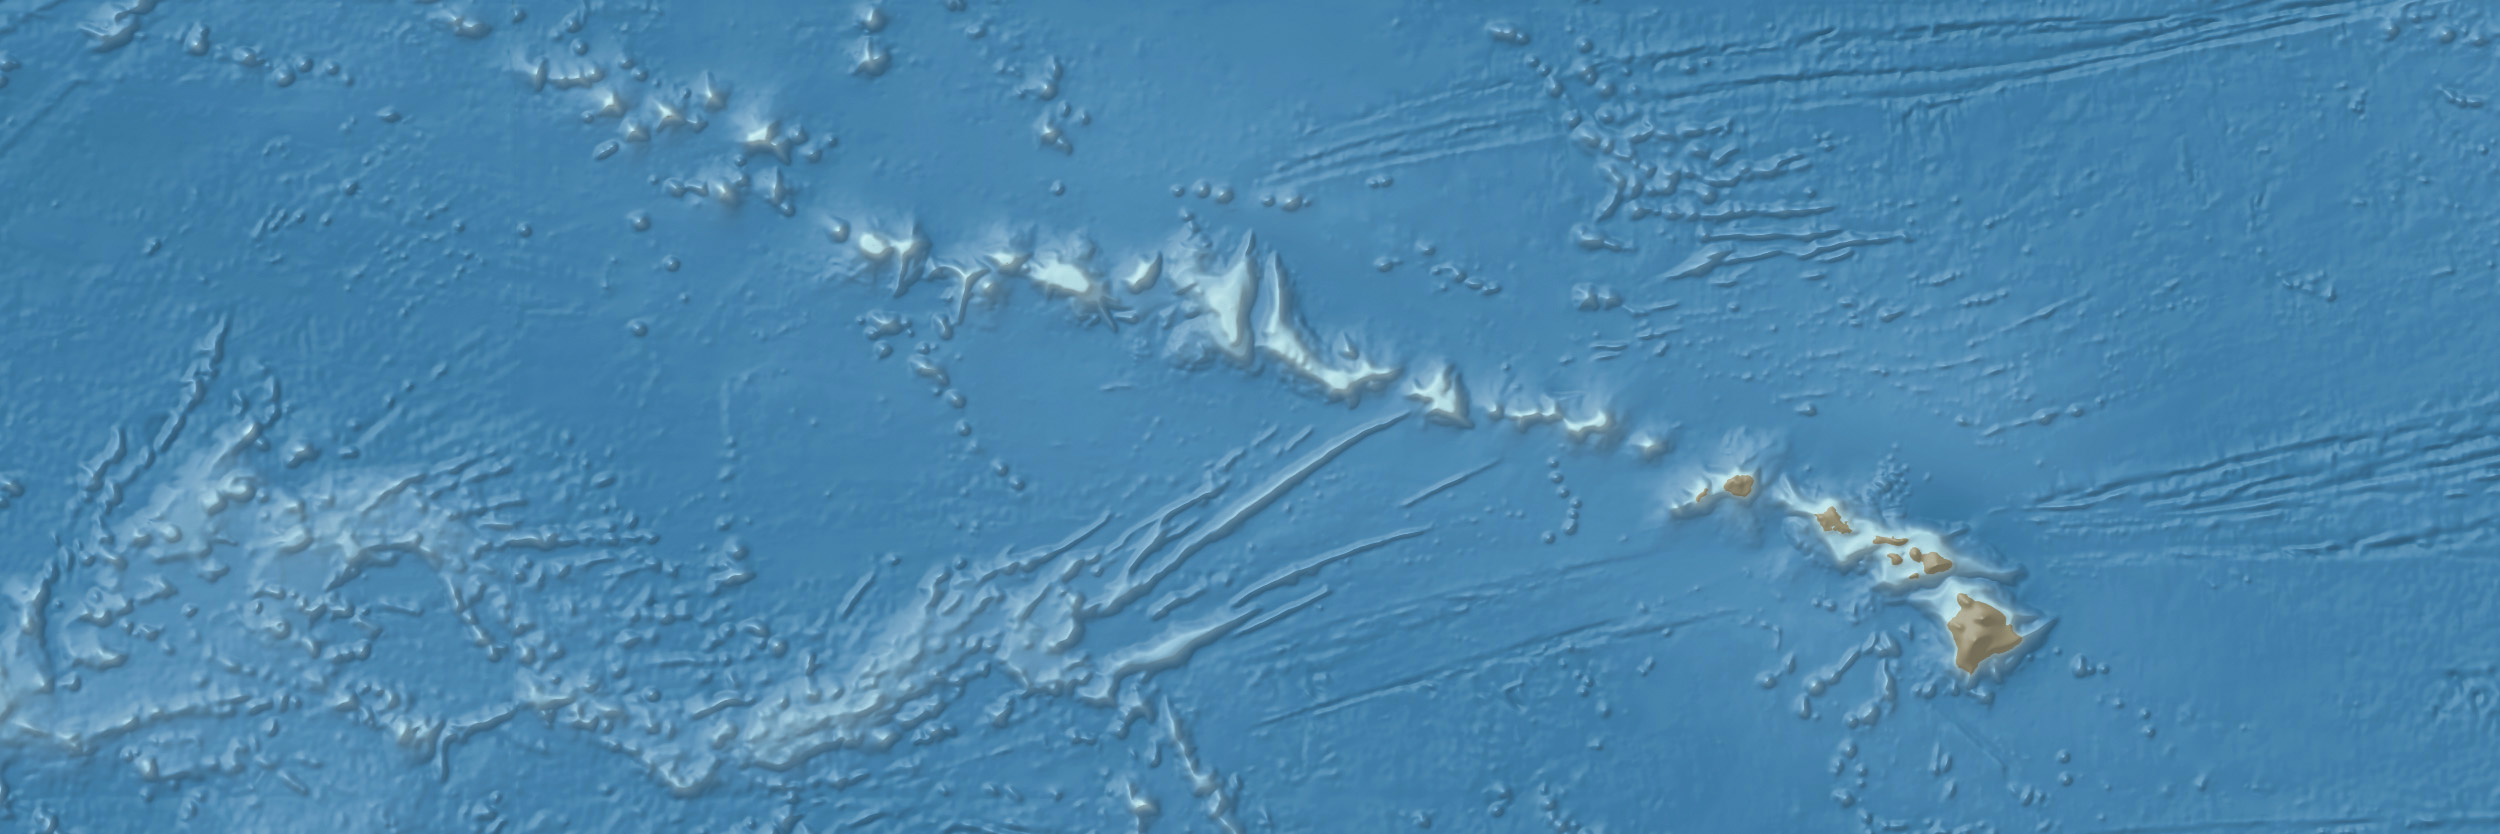
Ocean bottom maps without the noise
Blue Earth Bathymetry is an edited version of GEBCO (General Bathymetric Chart of the Oceans), a public domain dataset that combines ocean bottom and land elevation data of the entire world. Because GEBCO derives from a mix of sources and contains unsightly artifacts, I created Blue Earth as a smoother alternative for making small-scale maps. It is available as a free GeoTIFF DEM from which you can render seafloor maps much like those shown above. Blue Earth Bathymetry replaces CleanTOPO2, a similar product derived from less accurate sources that I released in 2006.
June 22, 2020
Blue Earth Bathymetry
Generalized GEBCO Data for Seafloor Mapping
Miscellaneous comments and tips
• Worldwide elevations on Blue Earth range from 6,655 to -10,528 meters, less than the top of Mt. Everest (8,848 m) to the Challenger Deep (-10,920 m), the highest and lowest points on Earth. Smoothing GEBCO as I did shaved off these elevation extremes, especially high mountain peaks that take up very little area.
• Sea level is pegged to the correct elevation on Blue Earth. However, extracted shorelines will appear generalized because of the data smoothing. I recommend using Natural Earth 1:10 million shorelines as a replacement.
• Land areas on the Blue Earth dataset received the same downsampling and filtering as the ocean bottom. No manual edits were made to land areas. On your map, you may wish to swap in a land shaded relief more to your liking.
• Bathymetric coverage includes the Caspian Sea, Lake Baikal, and the Great Lakes of North America.
• The seafloor beneath Antarctic ice shelves is not mapped.
• Despite my attempts to cleanse Blue Earth of artifacts, many still remain. If you see something that should not be in the data, please let me know about it. In Photoshop, you can use the Spot Healing Brush and other tools to touchup a shaded relief.
• If shaded relief or 3D rendering of Blue Earth Bathymetry looks too detailed on small maps, try downsampling or smoothing the DEM data before rendering it.
• A vertical exaggeration factor of 1,000 percent is a good starting point for rendering shaded reliefs.
Contact me
Please report any problems. I would also like to hear your ideas on how to improve Blue Earth Bathymetry.
Tom Patterson
Download
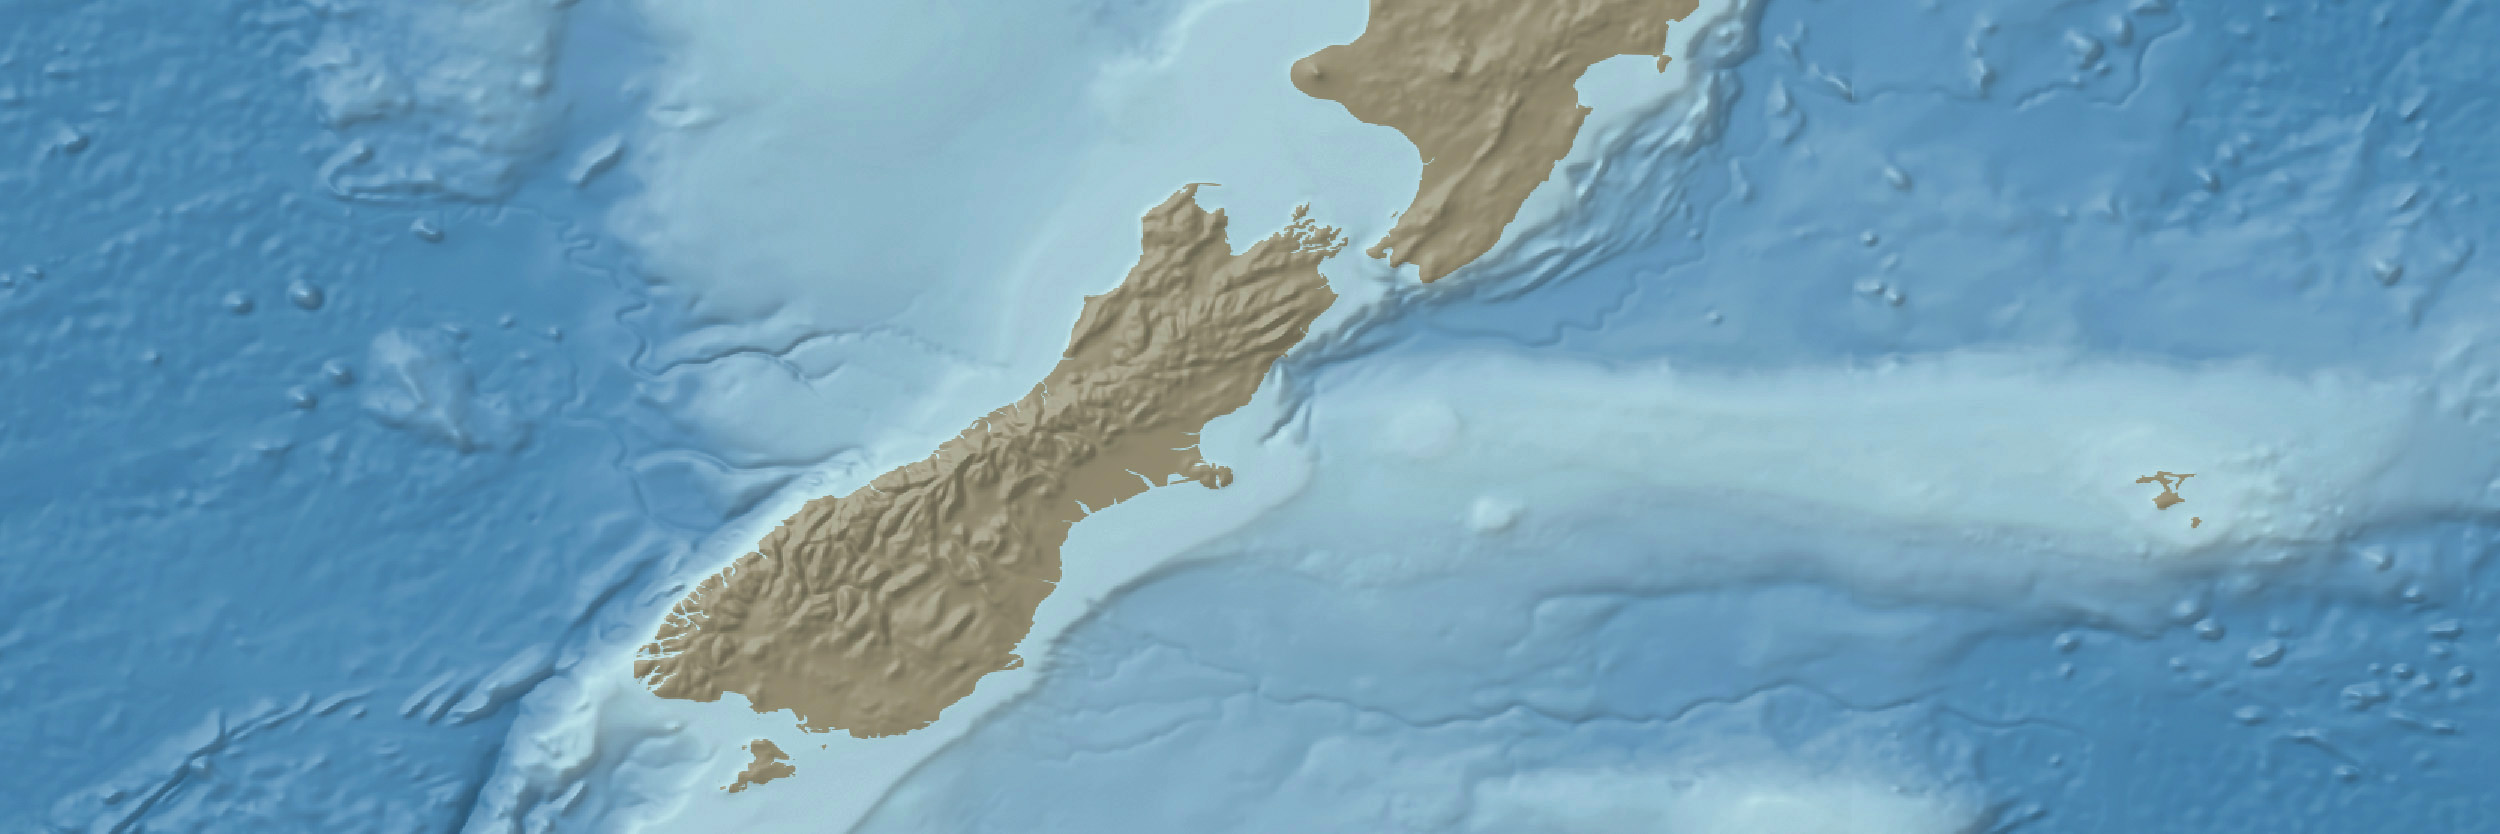
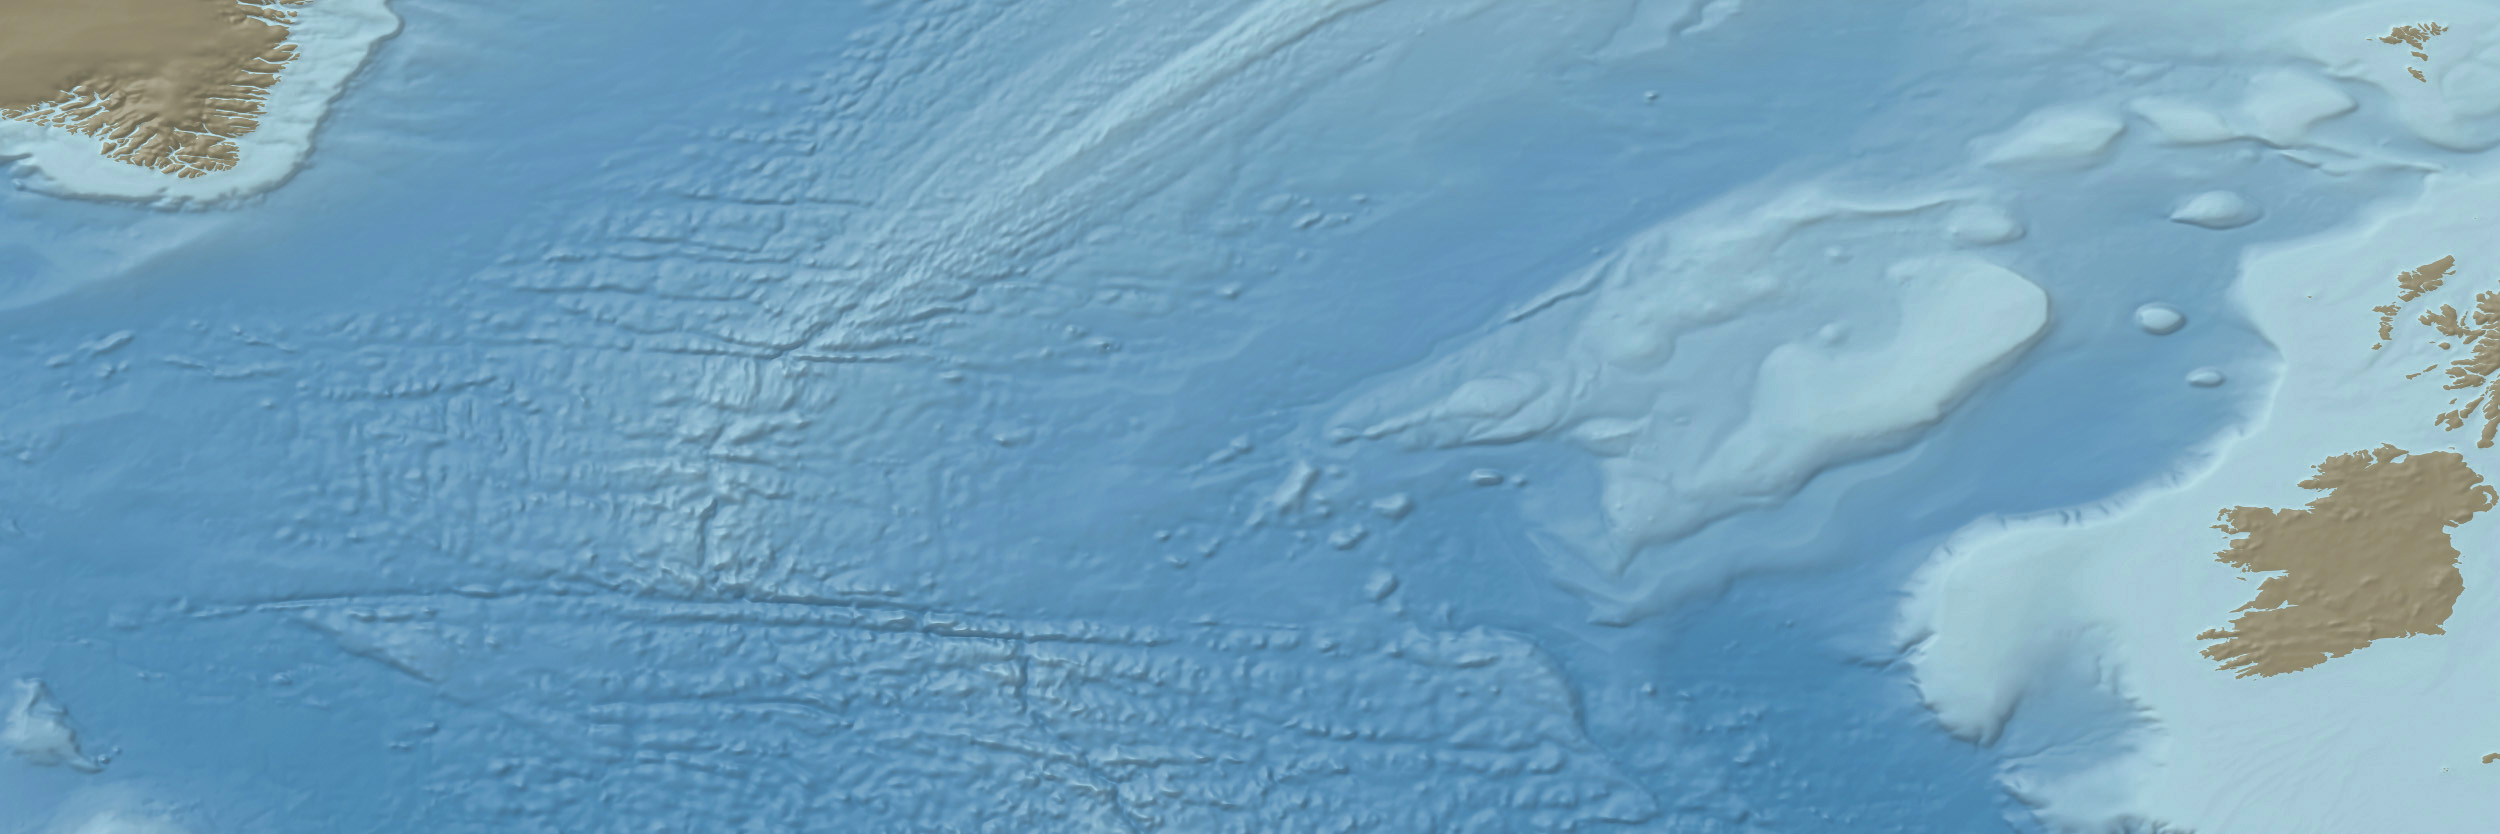
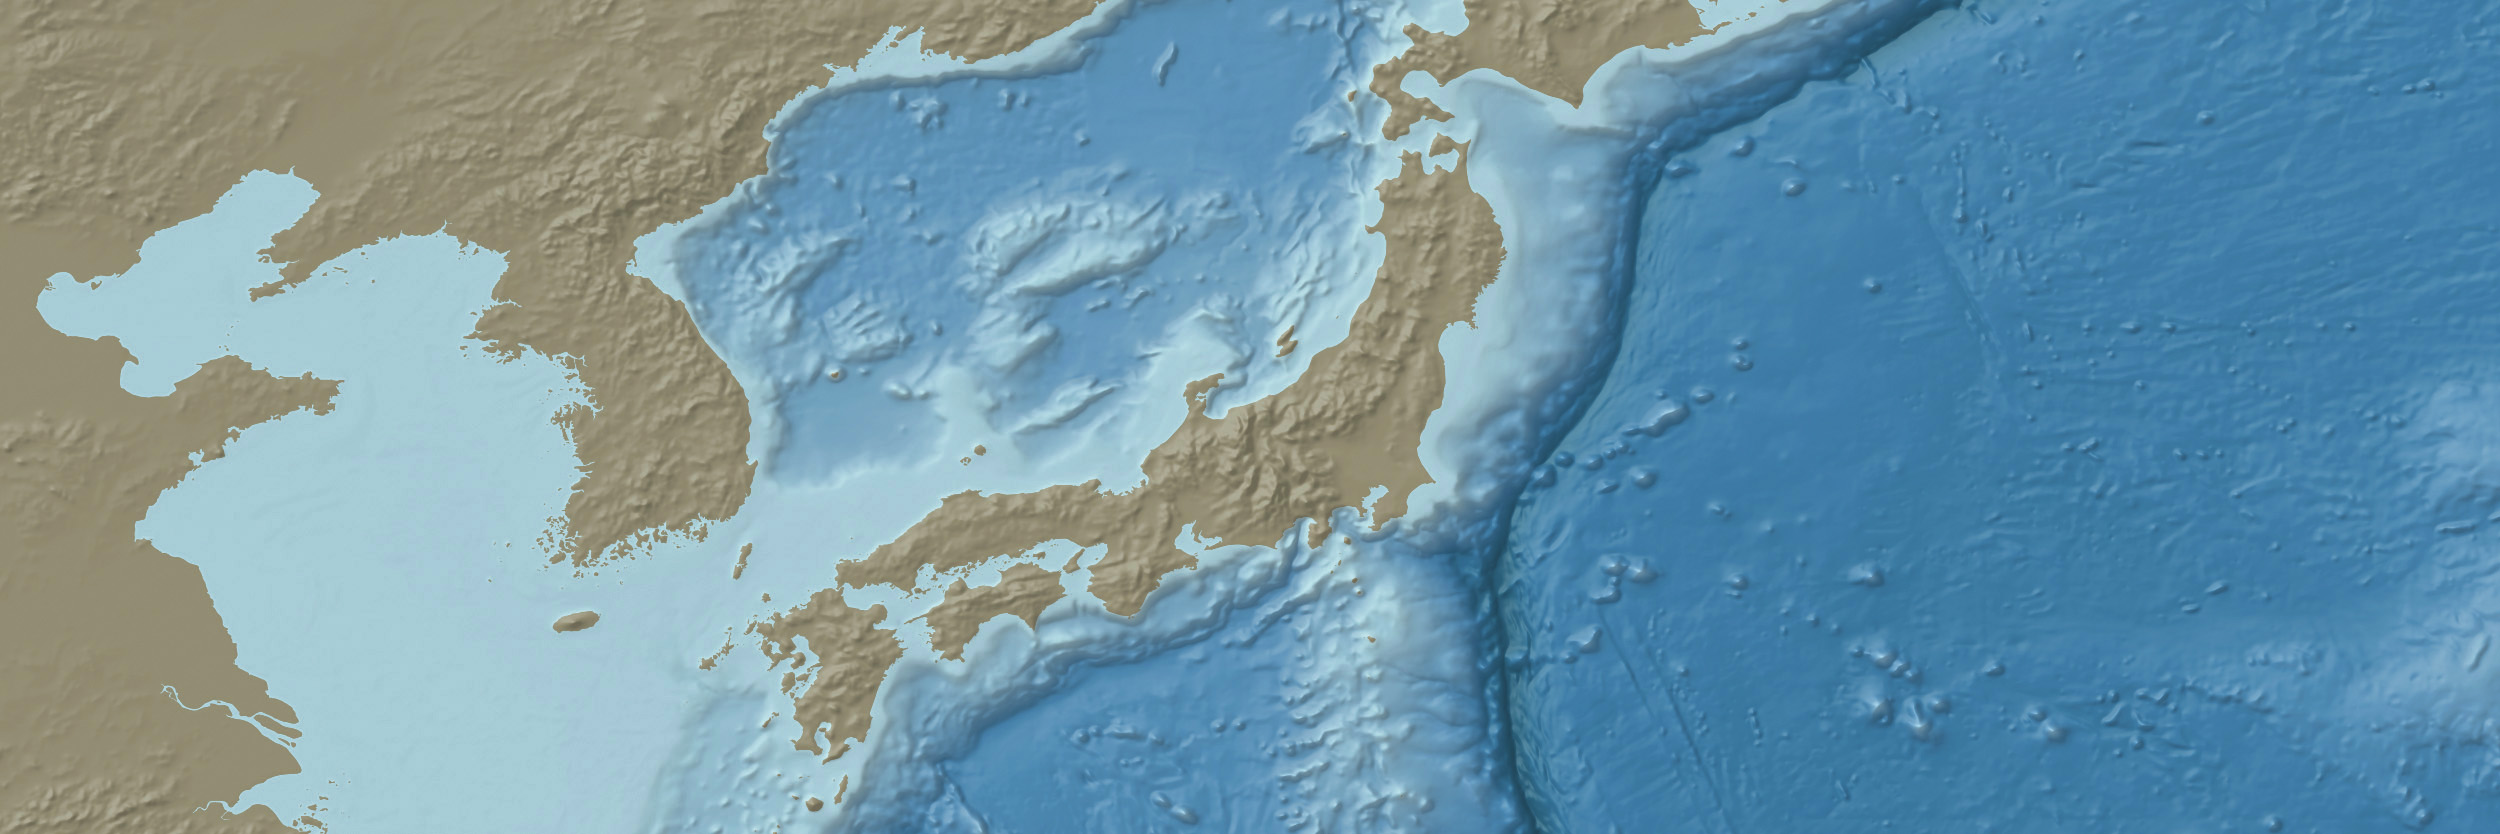
Maps rendered from Blue Earth Bathymetry
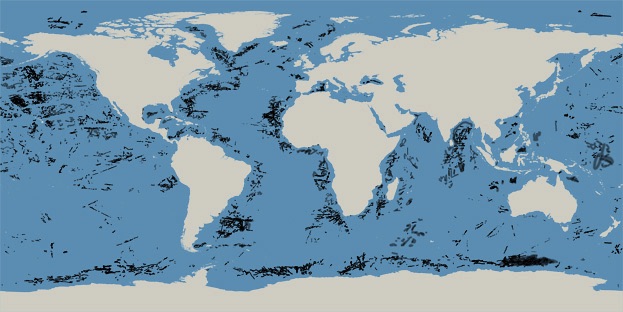
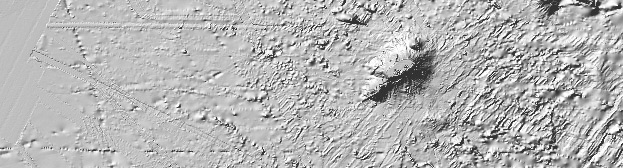
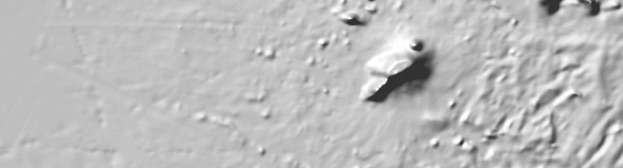
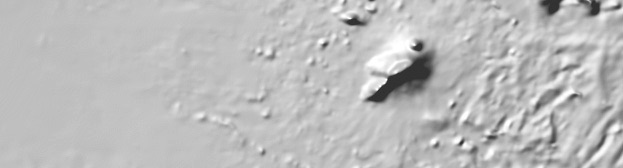
Figure 1. Blue Earth production steps: (top) Downsampled GEBCO bathymetry near Bermuda. (middle) Automated filtering. (bottom) Manual editing.

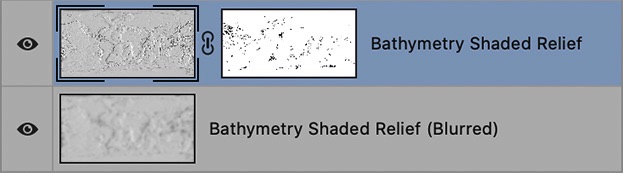
Layer Mask Transfer
About the data
The kilometers-deep layer of water that hides the ocean bottom from view also hinders the mapping of undersea topography. Satellite altimetry and multibeam sonar are the most common ways to collect bathymetry data, both of which have advantages and disadvantages. Satellite altimetry has mapped vast areas of the remote world ocean. The technique measures slight differences in sea surface height, compensating for tides and waves, to determine the bottom configuration. Satellite altimetry bathymetry data are coarse, however. The data have a spatial resolution of 5 kilometers and maps created from the data contain noticeable artifacts—random bumps and dimples that obscure subtle seafloor features.
Multibeam sonar collected by instruments towed behind survey ships, and now unmanned barges and buoys, yields much higher resolution bathymetry data for much smaller areas. To finish mapping the world ocean with multibeam sonar would take a single survey ship operating continuously for 1,000 years. Coverage is most complete in waters adjacent to Australia, Canada, Western Europe, Japan, New Zealand, and the United States.
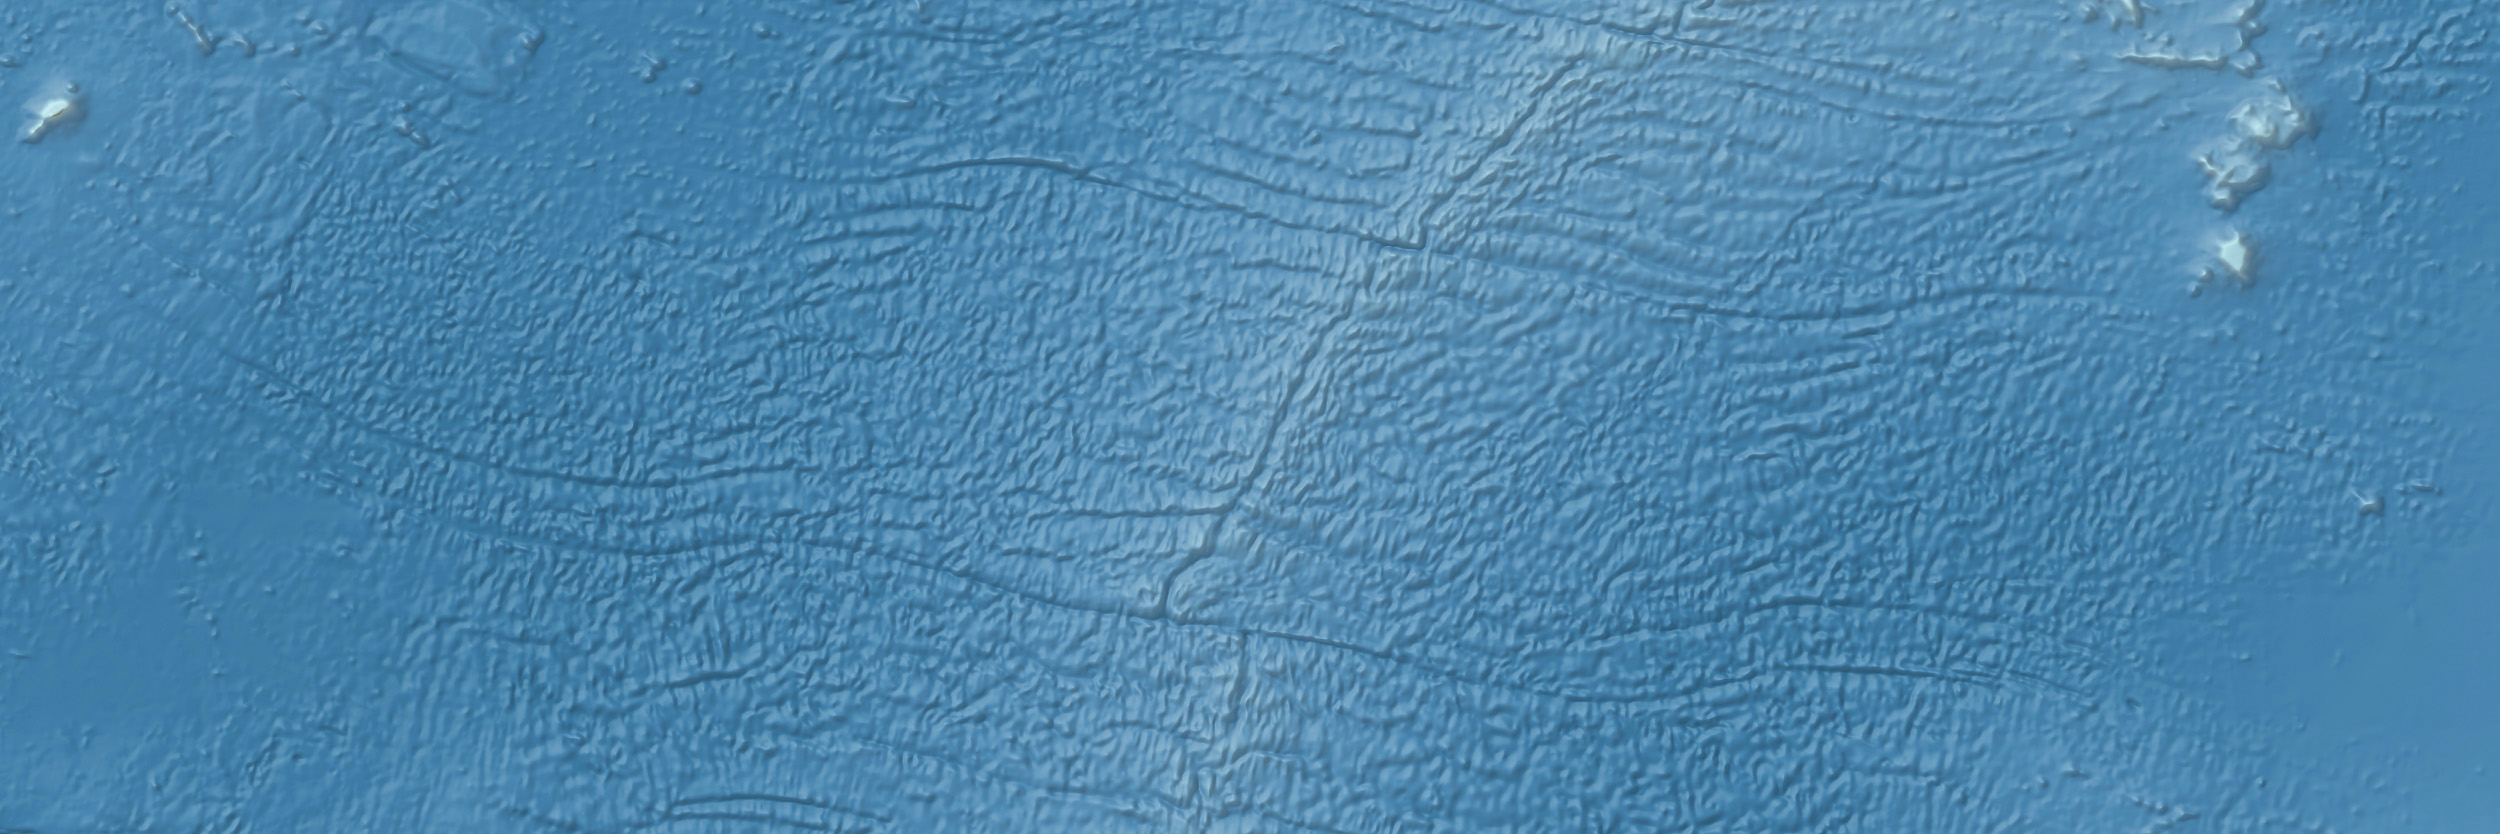
GEBCO bathymetry is a patchwork of satellite altimetry, multibeam sonar, and other sources. Figure 2 shows narrow swaths of multibeam bathymetry collected by survey ships sailing out of Cape Town located in the upper right. Interspersed between the swaths is bumpy satellite altimetry bathymetry. The two types of bathymetry are visually discordant because of their differing amounts of bottom detail and uncalibrated vertical datums.
That GEBCO has stitched all of these disparate data together is an amazing feat. Scientific research is the primary use. My goal with Blue Earth Bathymetry was smoothing out the rough edges, which is better for mapmaking.
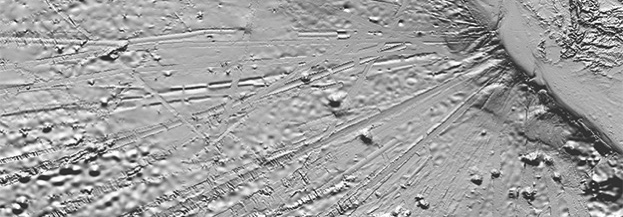
Figure 2. GEBCO bathymetry data west of Cape Town, South Africa.
Generalization
The first step when making Blue Earth involved throwing away data. I downsampled the original GEBCO bathymetry from 15-arc second resolution (86,400 x 43,200 pixels) to 60-arc second (21,600 x 10,800 pixels). I did this in Adobe Photoshop using bicubic interpolation on the 16-bit grayscale GeoTIFF DEM imported with the Geographic Imager GIS plugin. The imported DEM as specified in Geographic Imager had a world elevation range.
Next, I applied Reduce Noise (Strength=5) and Gaussian Blur (Radius=1.5 pixels) Photoshop filters to the downsampled DEM. Selecting the appropriate filter settings required experimentation. To visually inspect the effect of filtering on the DEM, I rendered shaded reliefs from them until I achieved satisfying results. The version that I settled on was a tradeoff between retaining topographic detail and eliminating unsightly "noise" (Figure 1, middle).
Manual edits
The generalization and filtering procedures reduced but did not eliminate ship tracks and other unwanted artifacts in the DEM. To attack these, I turned to manual editing, again accomplished in Photoshop on shaded reliefs rendered from the DEMs that I would eventually edit. It is much easier to see imperfections on a shaded relief than on a grayscale DEM.
The procedure was simple. In Photoshop, I duplicated the generalized and filtered DEM and applied even more Gaussian Blur to it. I then rendered shaded reliefs of both DEMs and placed each on separate layers in Photoshop with the blurred relief below. To remove or diminish artifacts, I painted on a layer mask with a soft brush that allowed the blurred shaded relief below to show through, healing the shaded relief above.
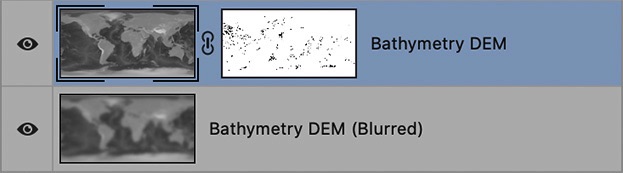
Because the edited shaded reliefs are proxies for the DEMs from which they derive, I could stack the DEMs on Photoshop layers and swap in the painted layer mask just created for the shaded reliefs (Figure 3). Lastly, I flattened the Photoshop file and used Geographic Imager to export the final GeoTIFF DEM.
Figure 3. Manual editing procedure in Photoshop.
Deciding what to edit
My editing focused on deep ocean basins where the bottom is flat and the artifacts are most noticeable. By contrast, the fractured topography of mid-ocean ridges received minimal editing. Here the artifacts largely become lost amidst the complexity, and editing is prone to degrading actual topographic features. Seafloor features are very different from those found on land, which made it difficult to differentiate between data artifacts and actual topography. When in doubt, I left things alone.
Some places required more editing than others (Figure 4). Problem areas included the North Pacific between Hawaii and the Aleutians and the Southern Ocean encircling Antarctica. A stretch of the Southern Ocean between 110E and 140E was particularly troublesome.
The southern Indian and Pacific oceans received little editing because of the lack of multibeam sonar data in these areas. Not that these areas are completely clean; the bumps and dimples of satellite altimetry are ubiquitous. I suppressed the bumps slightly in flat abyssal basins.
Besides obvious linear artifacts, I also removed or diminished other suspicious data. These included isolated pits and bumps on the continental shelves and abyssal basins that appeared unusually deep or high, suggesting erroneous depth values.
Manual editing took a little more than one day to complete.
Figure 4. Black marks indicate the extent of manual edits.
Terms of Use
Blue Earth Bathymetry is in the public domain. I recommend using it only for small-scale mapping. Do not use Blue Earth Bathymetry for navigation.
Read the terms of use for DEMs that derive from GEBCO data. Some conditions apply.
Version 1.0
June 22, 2020
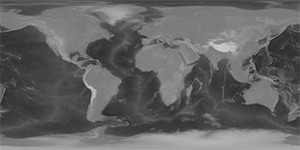
Worldwide
coverage!